Take a Photo. AI Fills the Form
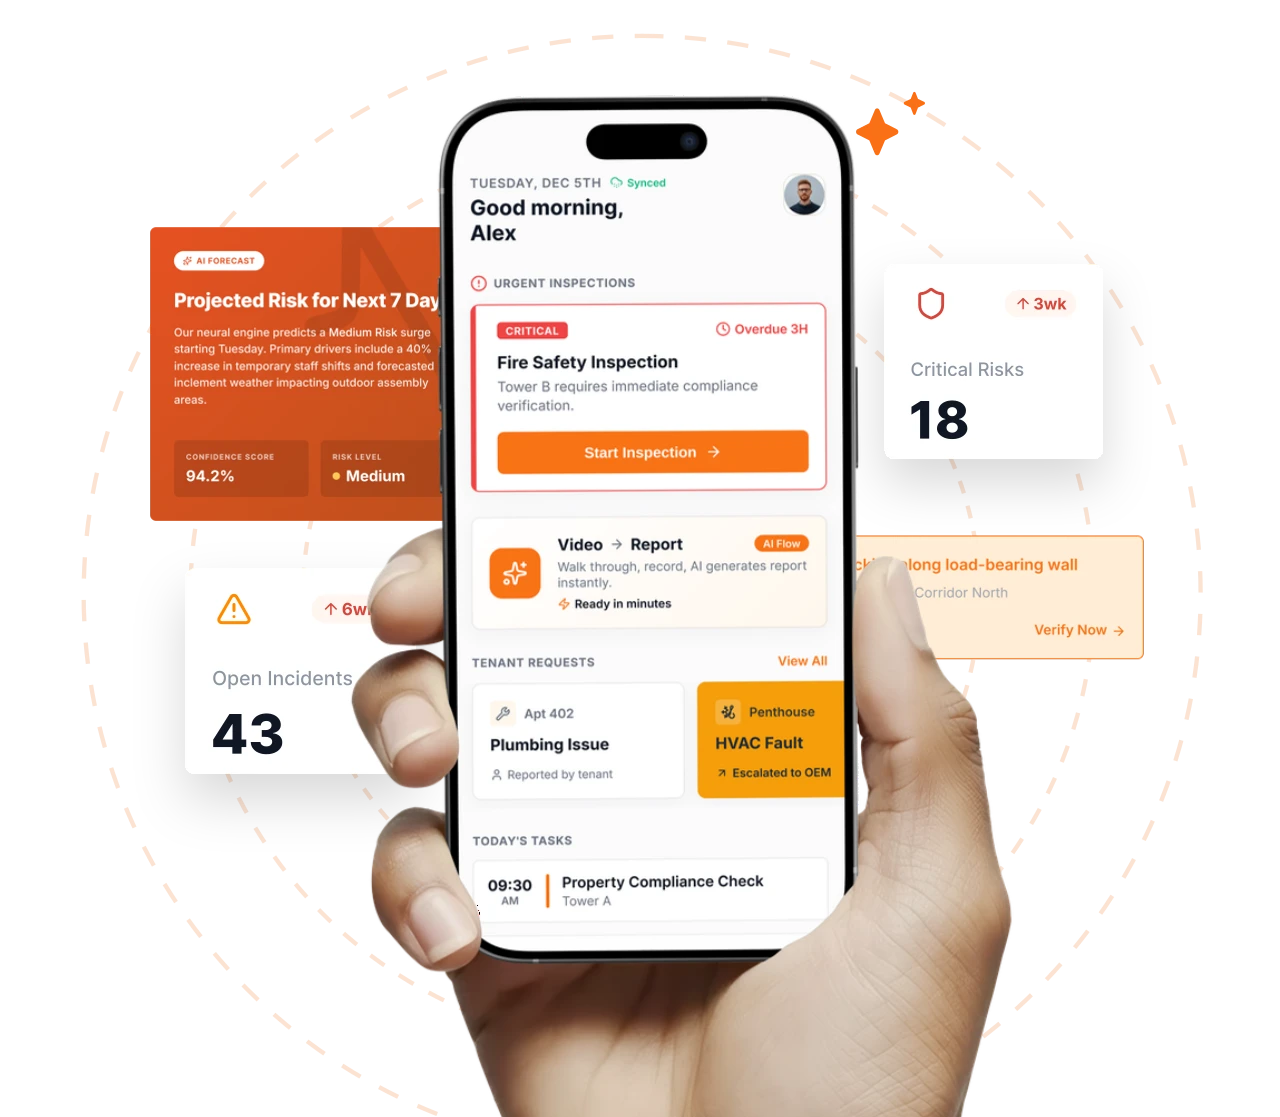
Your inspector takes a photo of any asset or defect. AI reads it and fills the inspection form automatically. No typing. No manual entry.

Convert your checklist into Mobile App
Site safety inspection monitoring software is the live portfolio layer above the safety app, the management governance layer, the audit layer, and the tracking layer: it carries the real-time leading-indicator dashboards, the AI-generated daily briefings, the anomaly detection on unusual safety patterns, and the portfolio-level scoring that lets an HSE director run multi-site safety programmes without depending on weekly compile cycles.
Everything your field team does on paper, Inspectly360 does automatically: faster, more accurate, and without the admin.
Your inspector takes a photo of any asset or defect. AI reads it and fills the inspection form automatically. No typing. No manual entry.

Inspectors speak their observations in any language. AI transcribes and fills the form in real time. Completely hands-free in the field.

The moment an inspection is submitted, a branded PDF, Excel, or CSV report generates automatically. No manual work. No waiting.

Inspectly360 integrates with the tools your team already uses, including Zoho, Microsoft 365, and SAP. No double entry.

Your operations team sees completion rates, open issues, and compliance scores across all sites in real time. No chasing updates.
What changes once site safety inspection monitoring software runs on one mobile-first platform with photo proof and live dashboards.
Site safety inspection monitoring software is the live portfolio layer above the safety app, the management governance layer, the audit layer, and the tracking layer: it carries the real-time leading-indicator dashboards, the AI-generated daily briefings, the anomaly detection on unusual safety patterns, and the portfolio-level scoring that lets an HSE director run multi-site safety programmes without depending on weekly compile cycles. Inspectly360 is built for HSE directors, corporate safety leads, and principal contractors who carry portfolio-wide accountability for safety performance.
For HSE directors, the platform replaces weekly site compile cycles, static PowerBI HSE dashboards, and 30-page Monday-morning report packs with live portfolio scoring, AI-written daily briefings, and anomaly detection that surfaces unusual safety patterns the day they start.
For principal contractors and boards, portfolio-level scoring across leading and lagging indicators changes board conversations from narrative to evidence-led strategic decision. Multi-context lifetime exposure (construction, industrial maintenance, energy, refurbishment) surfaces in one view.
Safety monitoring runs continuously and serves HSE leadership rather than field execution; the five-step loop below is what HSE directors standardise.
Define the scoring model per portfolio segment: leading-indicator score per site (hazard observations per shift, near-miss rate per 1,000 hours, JSA completion, toolbox attendance, PTW compliance, audit pass rate) and lagging-indicator score (recordable rate, lost-time, fatalities).
Configure who receives the AI-generated daily briefing (HSE directors, corporate safety leads, principal contractors, board), the briefing cadence, and the briefing scope.
Define anomaly thresholds per pattern: sudden near-miss spike on one site, repeat-hazard run against one contractor, surge in PTW non-compliance, regional pattern across operating contexts.
Real-time dashboards aggregate leading indicators, lagging indicators, contractor performance, and audit scores across construction, industrial, energy, and refurbishment safety programmes in one view.
Portfolio-level scoring with anomaly trend analysis and AI-written narrative briefings export as branded board HSE packs in one click.
Answers to common long-tail questions, kept on one canonical page to avoid thin duplicate URLs.
Safety monitoring in Inspectly360 sits as the operational portfolio layer beside the executive HSE analytics stack. PowerBI, Tableau, SAP EHS dashboards, Enablon, and Sphera SafetyHub continue to serve corporate HSE business intelligence. Inspectly360 owns the safety-specific real-time scoring, the AI daily HSE briefing engine, and the anomaly detection that requires safety-domain understanding.
HSE directors should validate seven monitoring requirements: live portfolio dashboards that load in under three seconds; AI daily HSE briefings configurable per audience; anomaly detection with tunable statistical significance; portfolio-level scoring across leading and lagging indicators; multi-context view across construction, industrial, energy, and refurbishment; SSO via SAML or OIDC; and BI integration to PowerBI, Tableau, or corporate HSE data lake.
Production portfolio monitoring carries board-level HSE performance data, contractor scorecards that may feed subcontract decisions, and incident trend analysis that may be subject to HSE inspector or insurance review. Inspectly360 supports audit-grade event logs, encrypted at-rest evidence, regional data residency, and tamper-proof scoring history.
Weekly HSE compile cycles do not disappear on day one; the rollout runs in parallel for the first cycle so the HSE director sees both the AI-generated daily briefing and the existing weekly compile. Within two cycles, the difference in briefing quality and timing typically makes the weekly compile redundant.
The platform capabilities that power site safety inspection monitoring software across every site.
HSE directors comparing Inspectly360 to weekly compile cycles, static PowerBI HSE dashboards, and site-led status calls care about five things specific to live safety monitoring: whether leading-indicator performance surfaces in real time, whether AI surfaces the right thing to look at on Monday morning, whether anomaly detection catches unusual safety patterns before recordables, whether portfolio-level scoring drives board HSE conversations on data, and whether the morning briefing arrives before the first meeting.
| Topic | Typical Gaps | With Inspectly360 |
|---|---|---|
| Real-time leading-indicator visibility | Leading indicators live in weekly HSE compile reports. The HSE director sees Tuesday's near-miss rate on Friday afternoon. Board-level HSE conversations open with stale data. | Live leading-indicator dashboards refresh as hazards raise, near-misses capture, and CAPAs close. The HSE director sees the same numbers the site safety officer sees, in real time. |
| AI daily HSE briefing rather than data dump | Monday morning means reading a 30-page weekly HSE report. By the time the HSE director identifies the priority site, half the morning is gone. | AI-generated daily briefing in plain language: which sites had Stop Work events yesterday, which contractors are off-plan, which need attention today. One-page narrative briefing before the first meeting. |
| Anomaly detection on unusual safety patterns | Unusual safety patterns (sudden near-miss spike on one site, repeat-hazard run against one contractor, surge in PTW non-compliance) get noticed late because pattern detection requires manual analysis. | AI anomaly detection surfaces unusual patterns in real time with statistical significance scoring. The HSE director sees the spike, the run, or the surge the day it starts. |
| Portfolio-level scoring for board HSE conversations | Board HSE reports compile from site-led narratives. Each site describes its safety programme in its own language; the board sees a story rather than a score. | Portfolio-level scoring across leading indicators (hazard observations per shift, near-miss rate, JSA completion, audit pass rate) and lagging indicators (recordables, lost-time, fatalities). The board sees the same scored data the HSE director operates on. |
| Multi-context view across construction, industrial, and energy | Active construction sites, industrial maintenance shutdowns, energy operations, and refurbishment projects each live in their own safety registers. The HSE director switches between systems to see portfolio-wide exposure. | One unified portfolio dashboard across construction, industrial, energy, and refurbishment safety programmes with state filters. The HSE director sees lifetime portfolio safety exposure in one view. |
What changes once site safety inspection monitoring software is standardised on Inspectly360.
Get started with inspection and audit checklist templates.

Safety inspections with hazard identification, corrective actions, and compliance reporting. Offline capture and evidence.
Report incidents and near-misses with details, photos, location, and timeline. Ready for safety or quality review.
Use these apps to run inspections and audits.

by Inspectly360
Monitor construction safety risks, open hazards, and corrective action progress continuously.

by Inspectly360
Monitor construction site activity, inspection progress, and issue status in real time.

by Inspectly360
Monitor site activity, inspection status, and issue risk across locations in real time.

by Inspectly360
Run site safety inspections on phones and tablets with offline forms, photo and voice capture, and instant reports.

by Inspectly360
Generate branded construction reports from structured field data, scores, and media with one-click export.
A static dashboard puts the burden on the HSE director: they have to choose what to look at, navigate the filters, and interpret the numbers themselves. The AI daily briefing reverses that flow. Overnight, the AI analyses the whole portfolio, identifies the priority sites, the priority anomalies, and the most pressing overdue items, and writes a one-page plain-language briefing in narrative form. The director reads it in a couple of minutes before the first meeting instead of spending twenty minutes pulling reports, and nothing important is missed simply because no one thought to filter for it. The briefing links straight through to the underlying records, so any line in it can be opened in full when it needs a closer look.
Anomaly detection runs a statistical-significance score on every candidate pattern before it raises an alert, so a random cluster of unrelated events does not trip the system. False-positive thresholds are tuned per portfolio segment, so a high-volume construction portfolio and a low-volume energy portfolio are held to different significance levels rather than one blanket setting that floods one and starves the other. The aim is a small number of alerts that each genuinely warrant attention, because an alert stream full of noise gets ignored and then the real signal is lost with it. When an HSE lead dismisses an alert, that feedback tunes the model, so over time the alerts that surface are the ones the team has shown it cares about.
Scores are normalised per portfolio segment, so a 500-operative construction site and a 50-operative industrial-maintenance shutdown are measured on comparable scales rather than the larger site dominating by volume alone. The leading-indicator score weights hazard-observation rate, near-miss rate, JSA completion, toolbox attendance, PTW compliance, and audit pass rate, and those weights are configured per operating context, because what signals good performance on a building site differs from what signals it on an energy asset. The result is a single comparable ranking across very different operations, so an HSE director can see which sites are genuinely strongest and weakest on safety culture rather than just which ones are biggest or busiest.
Yes. Plain-language queries run against the full portfolio data, with results filtered to whatever the user is allowed to see under RBAC, so a site officer and a corporate director asking the same question get answers scoped to their own access. Typical queries include 'which sites had the highest near-miss rate last month', 'which contractor has the worst PTW compliance this quarter', and 'show me critical hazards overdue more than 7 days across the portfolio'. The answer comes back as a figure, a chart, or a table without anyone building a report or learning a query language. Because it reads from the same live data as the dashboards, the answer is current rather than a snapshot from the last manual export.
Safety monitoring data feeds Enablon, Sphera SafetyHub, Cority, SAP EHS, ProcessMAP, and corporate HSE data-lake systems through the REST API, scheduled CSV export, or a direct ODBC connection, depending on what the corporate stack prefers. The feed carries the leading and lagging indicators, the contractor scorecards, and the incident records, so the corporate BI layer reports on field reality rather than on numbers re-keyed from spreadsheets. Those systems remain the system of record for enterprise HSE analytics and board reporting, while Inspectly360 supplies the field-execution data they were never built to capture. The integration runs on a schedule the customer sets, so the corporate dashboards stay current without anyone exporting and importing by hand.
Board HSE packs export as branded PDFs in one click, so the pack that used to take a Friday afternoon to assemble is ready on demand. A typical pack contains an executive summary with the portfolio HSE score, leading-indicator trends, lagging-indicator trends, contractor performance scorecards, repeat-hazard patterns, the anomaly alerts acknowledged during the period, a Stop Work event summary, and the forward-looking safety risk for the next quarter. Because every figure is drawn from the same live data the field captured, the board sees the same numbers the HSE team works from rather than a separately compiled version that can drift. The pack can be scoped to a region or a business unit, so each board sees only its own estate.
Site Safety Inspection Monitoring Software on Inspectly360 connects directly to the inspection apps, checklist templates, forms, industries, and adjacent solutions linked below.
See Inspectly360 in action with a live demo tailored to your needs. No credit card required.