Take a Photo. AI Fills the Form
Your inspector takes a photo of any asset or defect. AI reads it and fills the inspection form automatically. No typing. No manual entry.

Convert your checklist into Mobile App
One reporting platform for COOs, Operations Directors, and Heads of Analytics who need a defensible operational picture without waiting for the Friday compile. Live dashboards, automated narrative PDFs, and natural-language queries replace the spreadsheet-and-deck cycle.
Inspection reporting and business intelligence software is a system that converts the field-captured operational record into live dashboards, automated narrative PDFs, predictive risk signals, and warehouse-ready exports for executive and analytics teams. It replaces the Excel-and-deck Friday cycle with one canonical data layer feeding Power BI, Tableau, Looker, Looker Studio, Snowflake, and the corporate data warehouse already in use.
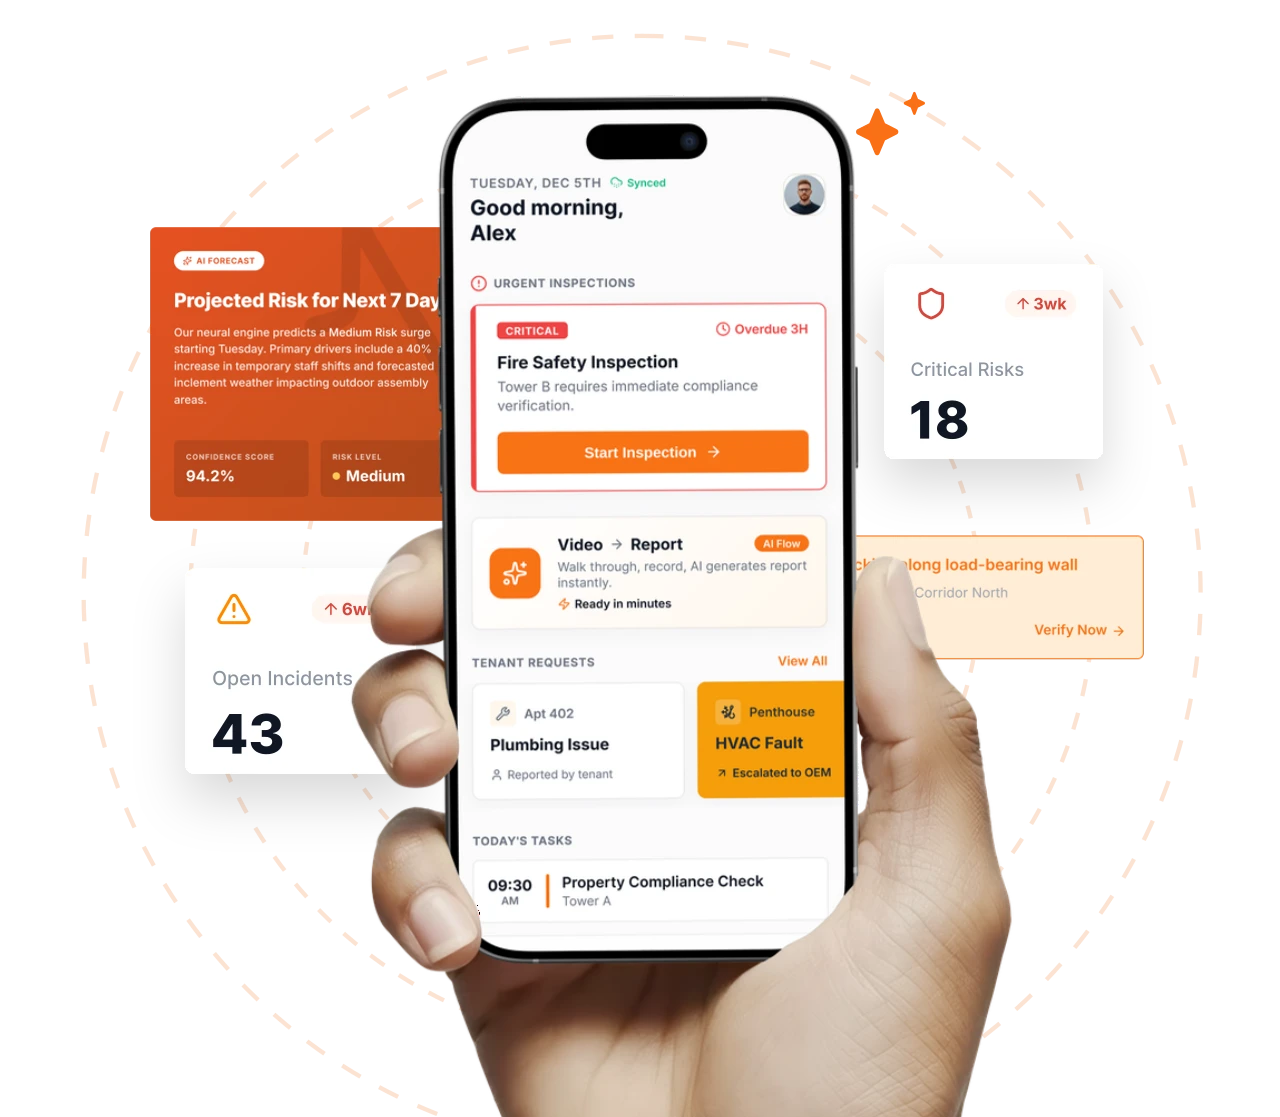
Everything your field team does on paper, Inspectly360 does automatically: faster, more accurate, and without the admin.
Your inspector takes a photo of any asset or defect. AI reads it and fills the inspection form automatically. No typing. No manual entry.

Inspectors speak their observations in any language. AI transcribes and fills the form in real time. Completely hands-free in the field.

The moment an inspection is submitted, a branded PDF, Excel, or CSV report generates automatically. No manual work. No waiting.

Inspectly360 integrates with the tools your team already uses, including Zoho, Microsoft 365, and SAP. No double entry.

Your operations team sees completion rates, open issues, and compliance scores across all sites in real time. No chasing updates.
What changes once reporting & business intelligence runs on one mobile-first platform with photo proof and live dashboards.
Inspection reporting and business intelligence software is a system that converts the field-captured operational record into live dashboards, automated narrative PDFs, predictive risk signals, and warehouse-ready exports for executive and analytics teams. It replaces the Excel-and-deck Friday cycle with one canonical data layer feeding Power BI, Tableau, Looker, Looker Studio, Snowflake, and the corporate data warehouse already in use. Inspectly360 is built for COOs, Operations Directors, and Heads of Analytics who need a defensible operational picture in time to make a decision rather than after.
For operations leadership, the platform replaces compiled board packs with live dashboards configurable by role, site, region, and program. Natural-language queries ("which sites missed PPM last week", "show me the top five recurring defects in Q3 by region") return filtered answers, charts, and tables without anyone authoring a report. AI-generated narrative PDFs render branded executive summaries, client SLA packs, and regulator-ready evidence with the underlying data attached.
For analytics and data teams, structured exports stream to the data warehouse so inspection, issue, asset, and workforce data joins with revenue, cost, customer-satisfaction, and HR data already in the BI stack. Anomaly detection on the same stream flags sites and assets trending toward compliance failure before the next manual review would catch them. The reporting layer stops being the bottleneck between what the field captured and what the boardroom sees.
BI rollouts run in three layers: standardise the operational data model first, then automate distribution, then connect the data warehouse and natural-language query layer once the underlying record is trusted.
Define the dimensions reporting depends on: site, region, program, asset class, severity, root cause, vendor, and inspector identity. Field capture writes against the same model dashboards and exports read, so reporting stops requiring a translation layer between operations and analytics.
C-suite dashboards focus on portfolio-wide KPIs and risk indicators. Operations Directors see program completion, escalation, and vendor scorecards. Site Managers see their sites only. Clients see their scope only. Each role gets the view that matches their decision rights, with drill-down to the originating inspection.
Templates render executive summaries, client SLA packs, regulator evidence packs, and board summaries with company branding and client white-label options. AI-generated narrative summarises trends, anomalies, and exceptions; the underlying evidence remains one click away.
REST API and scheduled exports stream to Power BI, Tableau, Looker, Looker Studio, Snowflake, BigQuery, and Redshift. Inspection, issue, asset, and workforce dimensions join with revenue, cost, customer-satisfaction, and HR data so leadership correlates field operations with business outcome.
Natural-language queries return filtered answers in seconds; anomaly detection on the same data stream flags sites trending outside the normal envelope before manual review catches them. The reporting cycle stops needing a human between the data and the question.
Answers to common long-tail questions, kept on one canonical page to avoid thin duplicate URLs.
Start with the one report leadership reads every week (typically the operations status pack or the compliance summary). Convert that report into a templated narrative PDF rendered from the platform on the same cadence, run it in parallel with the manual version for two cycles, and measure compile-time saved and decision-time gained. Layer role-based dashboards once the narrative PDF is trusted, then connect the data warehouse and natural-language query layer once the underlying data dimensions have stabilised. Existing BI investment is preserved; the platform produces the operational data layer that BI tool needs to be useful.
Validate SSO via SAML or OIDC, RBAC scoped at the data layer rather than UI, configurable retention windows for inspection, issue, and analytics data aligned to corporate retention policy, regional data residency for global operators, audit-grade event logs that survive litigation hold, and the documented integration path into Power BI, Tableau, Looker, Looker Studio, Snowflake, BigQuery, Redshift, or the corporate warehouse already in place. The integration path matters as much as the dashboards because the BI team will be more durable than any single dashboard configuration.
Existing report templates (Excel, PowerPoint, Word) convert into platform-native narrative PDF templates that render against live data. Standalone BI dashboards continue running where they add value; the platform feeds them via the warehouse export rather than competing with them. Historical inspection and issue records import as searchable evidence so the dashboards have history from day one rather than waiting for the first quarter of native data. Manual report distribution lists migrate to platform subscriptions so the audience sees the same artefact in the new flow.
The platform capabilities that power reporting & business intelligence across every site.
COOs and Operations Directors comparing Inspectly360 to spreadsheets, standalone BI tools, generic reporting apps, and enterprise GRC dashboards look at five things: whether the data source is defensible without a manual translation step, whether reports leave the operations team on schedule without manual assembly, whether dashboards respect the role boundaries the operation depends on, whether the warehouse export is structured enough to feed real BI work, and whether the natural-language query layer actually answers operational questions rather than running theatre demos.
| Topic | Typical Gaps | With Inspectly360 |
|---|---|---|
| Source-of-truth defensibility | Reports compile from clipboard data, WhatsApp threads, email attachments, and spreadsheets. By the time the board pack arrives, the underlying numbers cannot be traced to a defensible field record and the operations director hedges every claim. | Every reporting number traces back to a timestamped, inspector-attributed field record with photo evidence and audit-grade event logs. The board pack carries the same defensibility the OSHA, ISO, or customer audit needs. |
| Automated narrative PDF distribution | Friday afternoons disappear into compiling client SLA packs, board summaries, and regulator evidence. Manual report assembly limits how often, how granularly, and how reliably leadership and clients get the picture. | Branded narrative PDFs render on schedule (daily, weekly, monthly) to any stakeholder distribution list with anomaly highlights, AI-written executive summaries, and underlying evidence attached. The compile cycle disappears. |
| Role-based dashboard scoping | Every stakeholder sees the same Excel report or nothing at all. C-suite gets too much detail; site managers get too little context; clients get the wrong slice or get nothing because there is no scoped view to share. | Role-based dashboards filter by scope at the data layer. The COO sees portfolio risk; the site manager sees their sites only; the client sees their contracted scope only; the auditor sees a time-bound read-only view. RBAC enforces filters server-side so a tampered request cannot widen the scope. |
| Warehouse export and BI integration | Inspection data lives in a silo and the BI team rebuilds a parallel pipeline by hand. Joining inspection findings with revenue, cost, or customer-satisfaction sources is a quarterly project rather than a continuous capability. | REST API and scheduled exports feed Power BI, Tableau, Looker, Looker Studio, Snowflake, BigQuery, and Redshift with structured dimensions ready for join. Inspection, issue, asset, and workforce data joins with revenue, cost, customer-satisfaction, and HR sources continuously. |
| Natural-language query and anomaly detection | Asking a new operational question means writing a new SQL query, building a new pivot table, or asking the BI team for a ticket. Most operational questions never get asked because the friction outweighs the value. | Natural-language queries return filtered answers, charts, and tables in seconds. Anomaly detection on the same stream flags sites and assets trending outside normal before manual review catches them. Operational curiosity stops being expensive. |
What changes once reporting & business intelligence is standardised on Inspectly360.
Get started with inspection and audit checklist templates.

Standard site-level inspections for construction, safety, and compliance. Capture conditions, photos, and follow-ups in one place.

Inspect assets and equipment: condition, location, photos, and maintenance history. Track condition over time.

Complete work orders with checklist items, photos, and sign-off. Track completion and proof of work.

Preventive and corrective maintenance inspections. Log repairs, parts, and condition with photos and follow-ups.
Use these apps to run inspections and audits.

by Inspectly360
Generate inspection reports with findings, evidence summaries, and actionable follow-up.

by Inspectly360
Analyze inspection trends, recurring issues, and performance metrics across locations.

by Inspectly360
Generate clear audit reports with findings, risk summaries, and action recommendations.

by Inspectly360
Analyze audit trends, control effectiveness, and recurring findings across teams and sites.

by Inspectly360
Analyze compliance trends, recurring gaps, and closure performance across teams and locations.
Typical examples include "which sites missed PPM last week", "show the top five recurring defects in Q3 by region", "what is the current escalation backlog by vendor in the eastern region", "how does first-pass yield compare to last quarter for line three", and "which AMC contracts expire in the next ninety days with vendor score below threshold". Queries can drill across inspection, issue, asset, workforce, and AMC dimensions filtered by site, region, program, severity, and time window. The result returns as a chart, table, or filtered record set ready to share or schedule as a recurring report. Queries respect the same RBAC the dashboards do, so a regional director sees their region only.
Executive dashboards are configured by the customer's analytics or operations team using a no-code drag-and-drop widget builder. Each dashboard carries a role, site scope, and time-window filter inherited at runtime so the same dashboard renders different data per viewer. Widgets cover KPI tiles, trend charts, comparison charts, anomaly callouts, heatmap, geo-map, and narrative blocks. Templates ship for COO, Operations Director, Site Manager, Auditor, and Client roles; customers fork them and own the variations. Configuration changes are versioned with named approvers so the dashboard the board sees on Monday is the one the analytics team last reviewed, not whatever someone moved on Friday.
Distribution lists can be managed centrally (analytics team curates the list) or self-service (stakeholders subscribe to what they want). Each subscription carries the report template, the cadence (daily, weekly, monthly, quarterly), the scope filter, and the delivery channel (email, secure download link, customer portal, or push to SharePoint, Google Drive, or Microsoft Teams). Subscription audit logs record who subscribed to what and when, which matters when sensitive operational data is being distributed externally. Recipients can unsubscribe from any individual subscription without losing access to others.
Anomaly detection runs on the inspection, issue, asset, workforce, and SLA data streams against configurable thresholds and learned baselines. A site whose PPM compliance trends below 90 percent for two consecutive weeks flags. A vendor whose closure time crosses two standard deviations above their own baseline flags. A defect category whose monthly volume exceeds the trailing 6-month mean by 50 percent flags. Thresholds are configurable per program and per audience so a board-level alert is tuned differently from a site-level operational alert. Flags route via email, push, in-app, and webhook to the configured stakeholders with the supporting evidence attached.
REST API and scheduled exports support JSON, CSV, Parquet, and direct connector to Snowflake, BigQuery, Redshift, Azure Synapse, and Databricks. Dimensions include site, region, program, asset, asset class, inspector, inspector role, vendor, severity, root cause, customer, batch and lot (manufacturing), shift, geo-coordinates, and time-window roll-ups. Fact tables include inspection events, issue lifecycle, work-order events, SLA timer events, AMC contract events, and workforce events. The schema is documented for the customer's data engineering team, so joining inspection data with revenue, cost, customer-satisfaction, and HR sources is a routine engineering task rather than a project.
Yes. Dashboards render natively on iOS and Android with the same scoping, drill-down, and natural-language query layer the desktop offers. Executive iPad apps are common for COO and Regional Director use cases. Push alerts deliver anomaly flags and SLA breaches to the executive's device with the supporting evidence one tap away. Mobile dashboard configuration is the same configuration the desktop dashboard uses, so the analytics team configures once and the executive sees the same view on whichever device they pick up.
Inspection Reporting & Business Intelligence on Inspectly360 connects directly to the inspection apps, checklist templates, forms, industries, and adjacent solutions linked below.
See Inspectly360 in action with a live demo tailored to your needs. No credit card required.